BahaWatch

We are in talks with PhilDev about a possible collaboration between BahaWatch and its partner universities in the Philippines. This section shows what that collaboration could look like.

    BahaWatch

    BahaWatch

    Low-cost, open-source, locally operated flood sensing for Philippine communities (and beyond).

    Baha (ba-HA) means “flood” in Tagalog and Cebuano.

    The dashboard is a working demo: real maps and terrain, simulated sensor readings.

    Why BahaWatch

    In a flood, minutes matter

    Our partner on the ground, the Bike Scouts ProjectA Philippine network of volunteer cyclists who carry messages, supplies and help when roads are blocked and phone lines are down after a disaster., is a volunteer network that helps families evacuate. They told us that even 15 minutes of warning is enough to move a family to higher ground instead of waiting on a rooftop for rescue.

    Floods cost the Philippines an estimated US$500–625 million a year (source: Global Climate Risks, Philippines (floods), citing the World Bank Climate Change Knowledge Portal), and disasters kill more than 1,000 people in an average year (source: Give2Asia, DisasterLink country profile: the Philippines).

    Sensors are too costly to reach everyone

    A standard government stream gaugeA permanent station on a river that records the water level every few minutes and sends it in for flood warnings. The costs here come from the US Geological Survey’s national network. in the United States costs US$25,000–40,000 to install and US$16,500–32,000 a year to run (source: Congressional Research Service, U.S. Geological Survey streamgaging network (R45695), 2021). At that price, remote and low-income places go without, and when funding changes, sensors fall into disrepair. Warnings come late, or not at all.

    BahaWatch’s sensor is estimated at about US$210, built from parts sold in local hardware stores.

    What we heard

    Since September 2025 we have held about 20 interviews with Philippine research and funding institutions, flood-sensing projects in the US and Vietnam, a nationwide volunteer disaster-response network, and flood-affected businesses and residents. Three themes came up again and again:

    1. Only affluent communities receive reliable flood warnings. Well-funded city governments can afford flood sensors; small islands and underprivileged communities, often closest to the water, cannot.
    2. Maintenance, not hardware, decides whether a network survives. Networks went dark when funding ended: prepaid SIM cards lapsed, batteries went flat and broken sensors were never repaired.
    3. Official warnings are neither local nor instructive. Agencies broadcast a storm’s position and strength; a household needs to know what will happen to its house, when, and what to do.

    “The Philippines does not have a technological problem, it’s a governance problem.”

    — a Filipino disaster researcher we interviewed

    Our answer

    Put flood sensing in local hands. BahaWatch pairs a low-cost water-level sensor that local governments and community groups can build, repair and run with a free, open dashboard that anyone can read. The hardware and software are open sourceThe designs and code are published for anyone to use, repair, copy and change, so a network never depends on one company staying in business., and the data is open, so the readings also serve national hazard maps and warning systems. Through openness, BahaWatch aims to help bring climate justice to a world that must adapt.

    How it works

    From a sensor on a post to a plain answer on a phone, in five stops.

    1. Measure

      A sensor in a white pipe, strapped to a gate post or a stake by a creek, points down and times an ultrasonic echoThe sensor sends a short burst of sound too high to hear and times how long its echo takes to bounce back from the surface below. Half that time multiplied by the speed of sound is the distance. off the water. Less distance means deeper water.

    2. Send

      Every 10 to 15 minutes it radios the depth over LoRaWANLong Range Wide Area Network: a low-power radio standard for small sensors. It carries tiny messages several kilometres on little battery, with no SIM card or mobile data plan to lapse. to a gatewayA receiver on a rooftop or tower that picks up the sensors’ radio messages and passes them to the server over the internet. One gateway can serve many sensors. kilometres away, which passes it to the BahaWatch server.

    3. Combine

      The server adds the depth to the ground height at the sensor to get the water’s surface levelThe height of the water’s surface above sea level, in metres: the same scale as the ground heights, so the two can be compared anywhere on the map., then stacks it on open map layers:

      • BarangayThe smallest unit of local government in the Philippines: a village, or a neighbourhood in a city. Barangay officials often lead the first response in a flood. (neighbourhood) boundaries
      • Building footprintsOutlines of buildings traced from satellite images by Google, Microsoft and OpenStreetMap volunteers. The model sends water around buildings, not through them.
      • Streets and creeks (OpenStreetMapA free map of the world made by volunteers, like Wikipedia for maps. BahaWatch takes streets, creeks and place names from it.)
      • Ground height (FABDEMForest And Buildings removed Copernicus DEM: a map of ground height in 30 m squares from the University of Bristol, made from satellite radar with trees and buildings taken out, so it shows the bare ground that water flows over.)
    4. Spread

      It carries that water level across the ground to nearby lower land, along streets and around buildings, and stops where the ground rises above it (see the figure below).

    5. Answer

      Residents see which streets are flooded and how deep, and get a plain answer to Babaha ba? (“Will it flood?”): Oo (yes), Baka (maybe) or Hindi (no). Neighbour reportsResidents can answer “Is there flooding here?” with Yes, No or Not sure. Reports can raise the answer to Baka (maybe); only a sensor can say Oo (yes). and rain on mapped hazard zonesAreas that UP Project NOAH’s flood maps show can flood in a 5-, 25- or 100-year rain. Heavy rain on those areas is a warning sign before any sensor sees water. help confirm it.

    From one sensor reading to a flood map Top: a side view along the street A–A′, showing the ground from the FABDEM terrain map and the buildings along the street. A sensor, a white pipe strapped to a post above the street, measures the water depth at one spot; the water level is carried left and right along the ground and stops at both edges where the ground rises above it. A dip beyond the right-hand rise is lower than the water but walled off, so it stays dry. Dashed black lines carry the two edges straight down to the map below. Bottom: the same place seen from above, as on the dashboard: the street flooded between the two edge marks on A–A′, the water going around the buildings, and the line A–A′ where the side view was cut. Side view along A–A′ (ground: FABDEM) measureddepth edgeedge water level = ground at the sensor + measured depth lower, butwalled off:dry edgeedge AA′ Seen from above, as on the dashboard

    From one reading to a flood map. A sensor knows the water depth at one spot. Added to the ground height there, it gives the water level. The dashboard carries that level along the ground from FABDEM, and the water reaches as far as the ground stays below it: the edges are where the ground rises higher. A dip beyond a rise stays dry even if it is lower, because the water cannot reach it. Seen from above, that becomes the flooded streets on the dashboard, with the water going around buildings. The level also drops 1 cm for every 15 m from the sensor, so estimates stay cautious far away. A–A′ marks where the side view was cut, along a street; the dashed black lines carry its two edges down to the map.

    In this demo, a storm generatorA program that makes up realistic sensor readings for a passing storm, so the dashboard can be shown before real sensors are installed. stands in for the sensors; everything after step 2 is the same code a live deployment would run. Read the details

    Explore the demo

    Team

    • Noam Anglo

      Noam Anglo

      Team lead · Master of Development Engineering ’26

      A Filipino-Canadian mechatronics engineer with years of taking startups from prototype to market, and years of wading through floods as a child in the Philippines.

      Noam on LinkedIn
    • Tim Groeschel

      Tim Groeschel

      Business development lead · MS Energy and Resources ’27

      Brings experience in business development, strategy and project management from sustainability consulting, cleantech and climate adaptation policy.

      Tim on LinkedIn
    • Gregor Posadas

      Gregor Posadas

      Dashboard and flood model lead · PhD student, Civil and Environmental Engineering

      An environmental engineer with an MS in Civil Engineering who builds the BahaWatch dashboard and its flood model. His research looks at Philippine water governance and infrastructure.

      Gregor on LinkedIn

    All three are at the University of California, Berkeley.

    Collaborators

    Partner with us or support BahaWatch if you…

    • have put sensors through a typhoon or a monsoon: we want to know what broke first;
    • work with communities that would own and look after sensors: tell us what worked and what did not;
    • are a local government, university or disaster group that wants a pilot;
    • fund disaster resilience, open hardware or open data.
    Get in touch

    Timeline

    1. Sensor prototypeby October 2026
    2. Software platformby January 2027
    3. Pilot projectby January 2027
    4. Manufacturingby January 2027
    5. Sensor rollout and maintenancefrom February 2027

    Contact

    For partnerships, pilots, funding or questions, write to our team lead.

    Noam Anglo nanglo@berkeley.edu
    BahaWatch

    Flood history

    Floods are part of life in the Philippines. Behind every number on this dashboard are families who wade to work, carry what they can, and wait on rooftops for rescue. This page remembers some of them.

    Some photographs show homes destroyed by storms. None show people who died.

    The floods

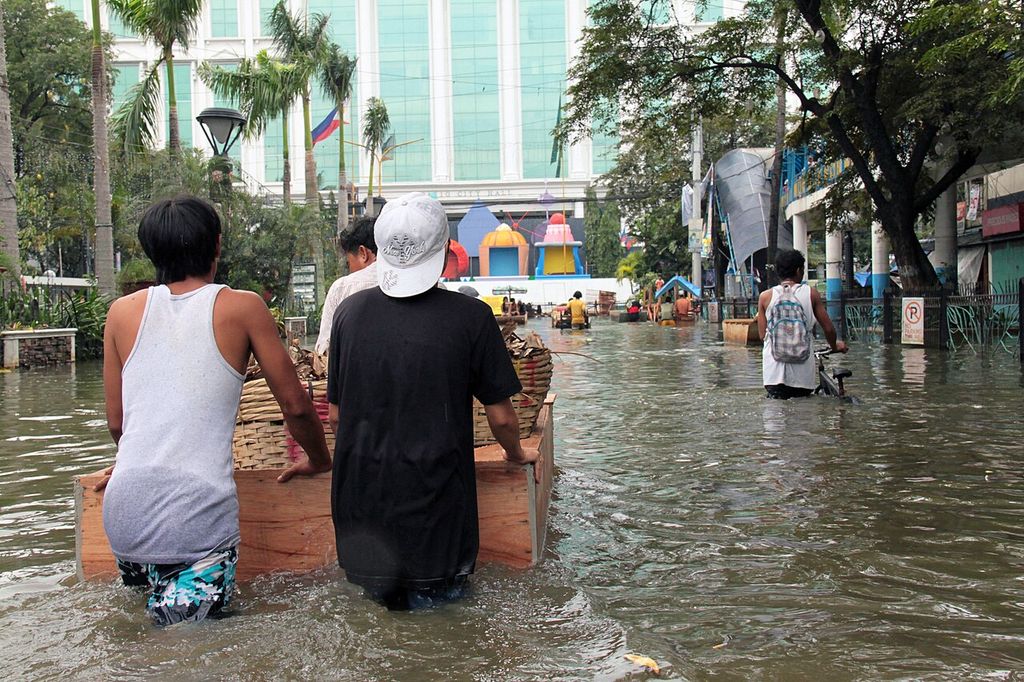
    Two men push a wooden handcart through brown floodwater along a city street; more people wade behind them.
    Metro Manila, 8 October 2009. Floodwater from Ondoy had still not drained nearly two weeks after the storm.Photo: AusAID (Department of Foreign Affairs and Trade, Australia) · CC BY 2.0 · Wikimedia Commons
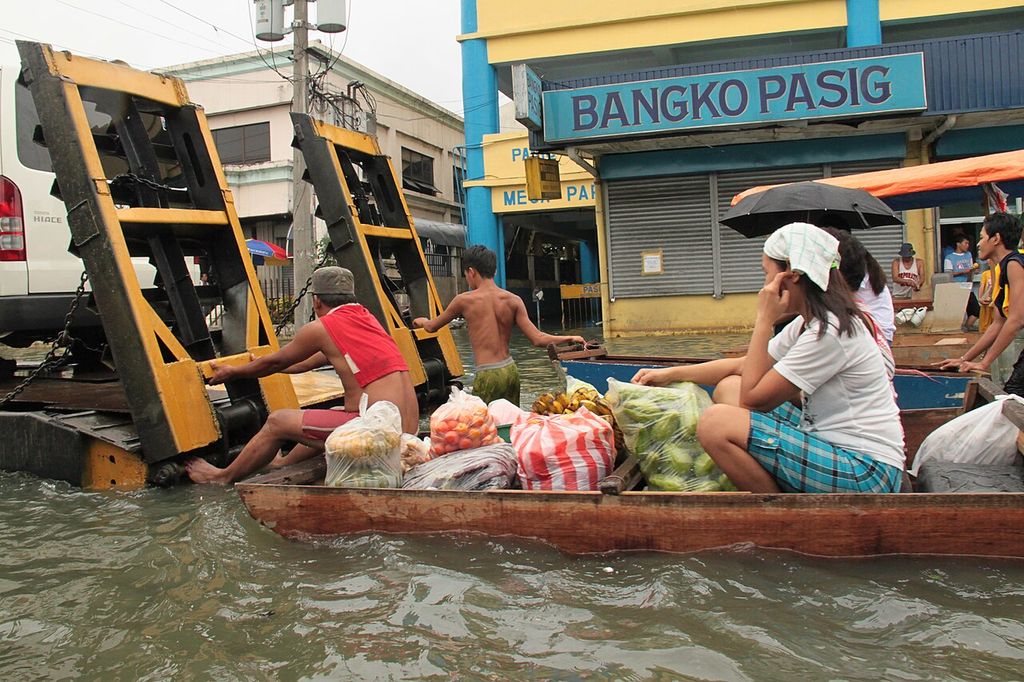
    A wooden boat loaded with sacks of vegetables and passengers moves along a flooded street past a shop sign reading Bangko Pasig.
    Pasig, 8 October 2009. A boat carries people and produce along a street that was still under water.Photo: AusAID (Department of Foreign Affairs and Trade, Australia) · CC BY 2.0 · Wikimedia Commons

    2011 Sendong (Washi)

    The storm crossed Cagayan de Oro around midnight on 16–17 December, and the river rose from about 2 m to 10 m, sweeping through riverbank settlements. Many people drowned in their sleep. 1,268 died (source: Inquirer, “What went before: Tropical Storm Sendong”, 28 Dec 2014) in Cagayan de Oro, Iligan and nearby provinces; 181 bodies were never recovered (source: Heinrich Böll Stiftung, “10 years after Typhoon Sendong”, 21 Oct 2022).

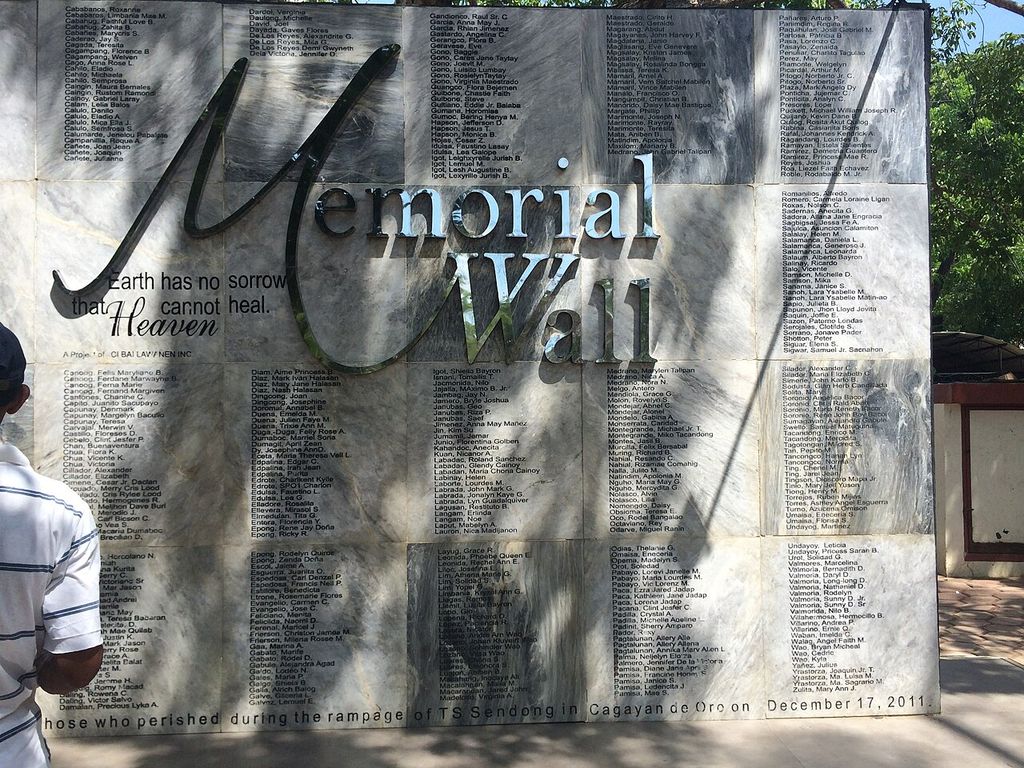
    A stone memorial wall in a park, engraved with rows of names under the words Memorial Wall.
    Gaston Park, Cagayan de Oro, 2016. The memorial wall lists the names of those who died in the Sendong flood of 17 December 2011.Photo: Shywise · CC BY-SA 4.0 · Wikimedia Commons

    2012 The habagat (monsoon) floods

    Over four days in August the southwest monsoon, strengthened by two typhoons offshore, left about half of Manila under water (source: SBS News / AFP, “Half of Manila submerged”, 8 Aug 2012). By 17 August the national disaster council counted 109 dead and 4.2 million people affected (source: IFRC emergency appeal MDRPH010, citing NDRRMC as of 17 Aug 2012).

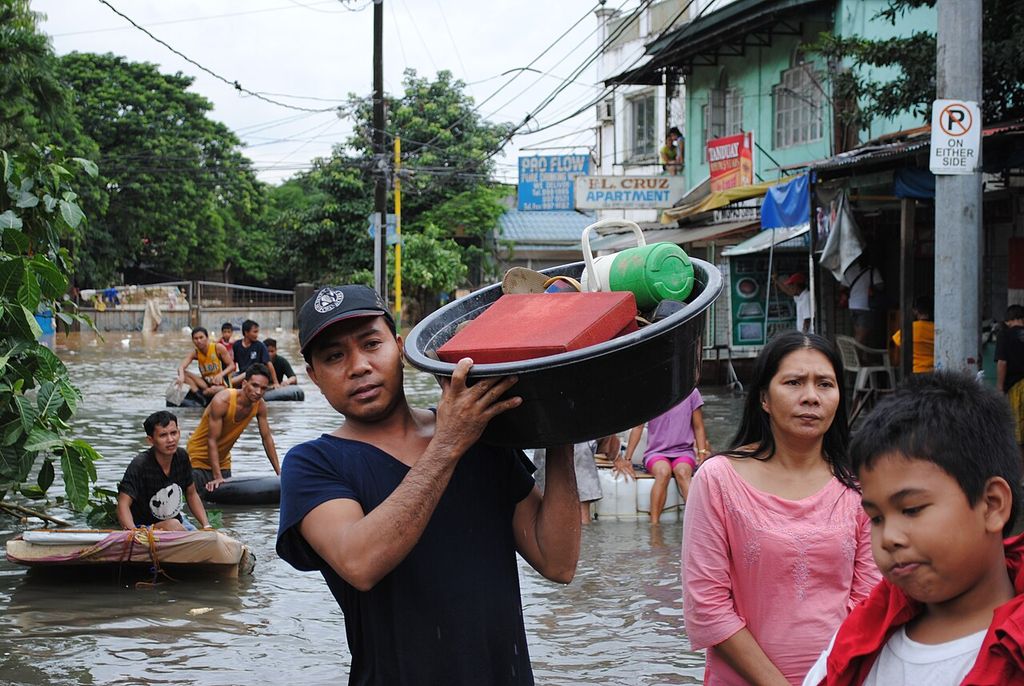
    A man carries a basin of belongings on his shoulder through floodwater, followed by a woman and a boy; others float on rafts behind.
    Manila, 8 August 2012. Residents carry what they can through the monsoon flood.Photo: AusAID (Department of Foreign Affairs and Trade, Australia) · CC BY 2.0 · Wikimedia Commons
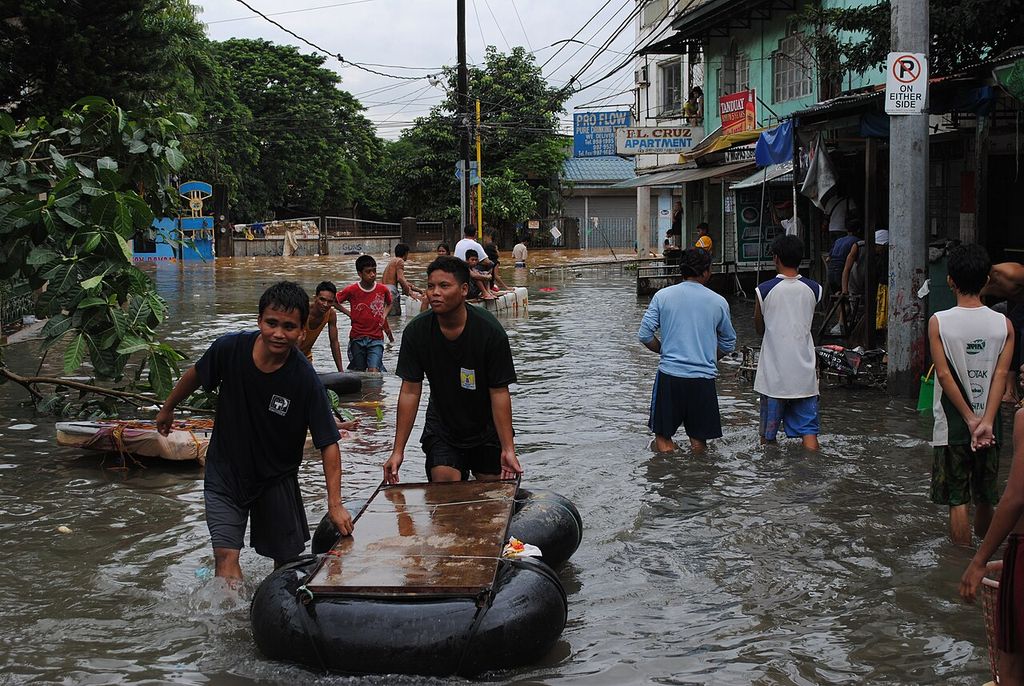
    Men push a makeshift raft on an inner tube through a flooded street lined with shops.
    Manila, 8 August 2012. A raft made from an inner tube moves people and goods.Photo: AusAID (Department of Foreign Affairs and Trade, Australia) · CC BY 2.0 · Wikimedia Commons

    2013 Yolanda (Haiyan)

    On 8 November Yolanda drove a storm surge into Tacloban and the coasts of Eastern Visayas. Nearly six months later the national disaster council counted 6,300 dead and 1,061 missing (source: GMA News, NDRRMC Yolanda toll, 17 Apr 2014).

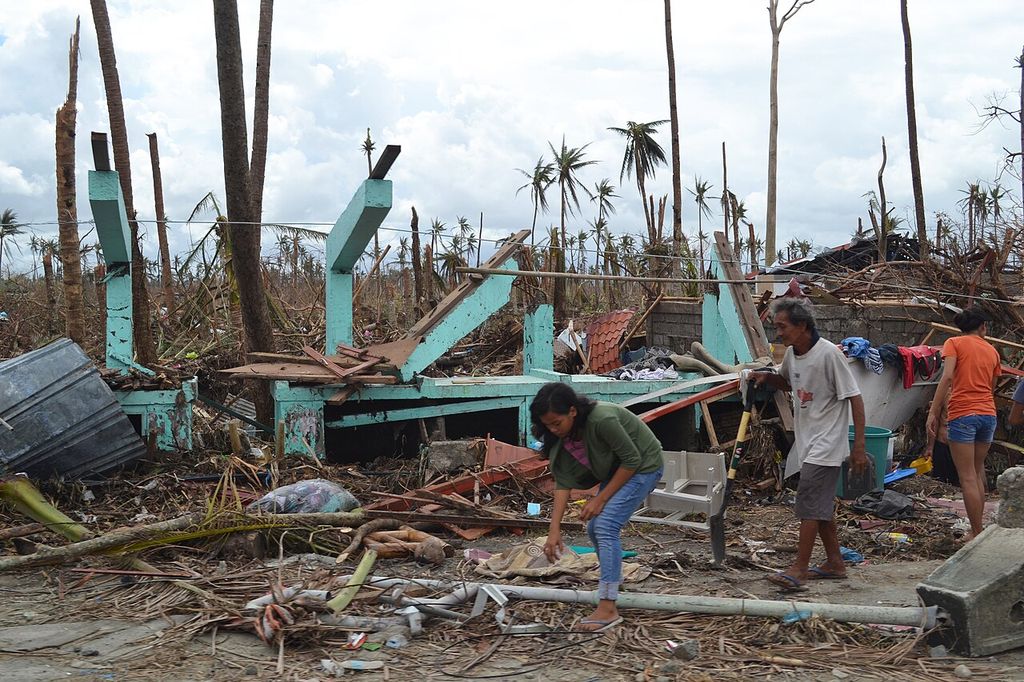
    People pick through the wreckage of a destroyed house among broken palm trees on the outskirts of Tacloban.
    Outskirts of Tacloban, Leyte, 13 November 2013, five days after Yolanda.Photo: Trócaire · CC BY 2.0 · Wikimedia Commons
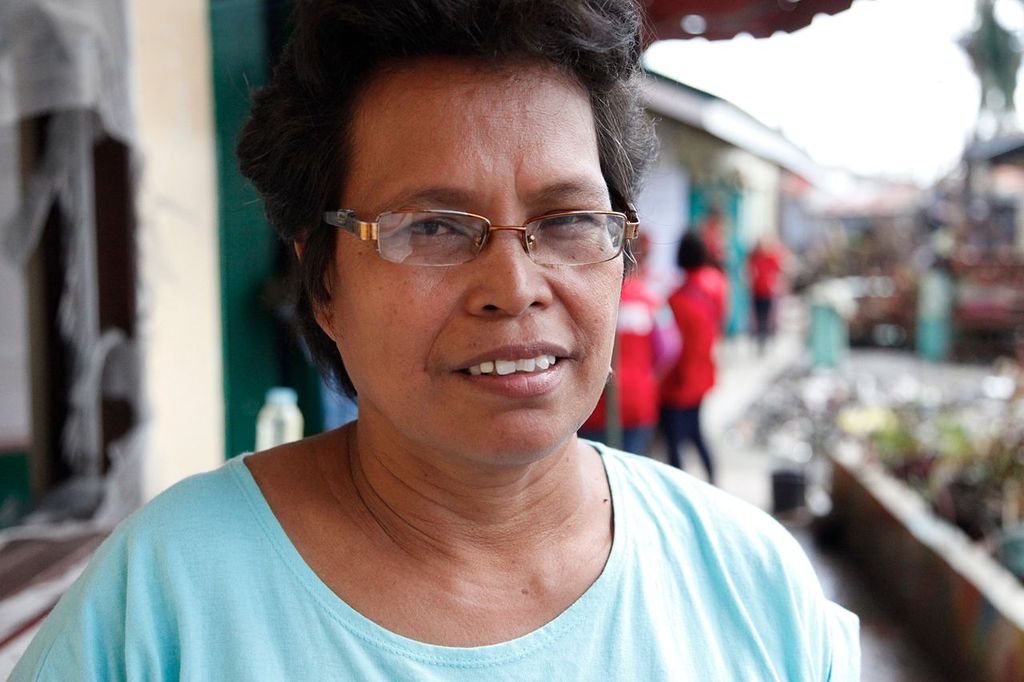
    Portrait of a teacher in a light blue shirt standing in a damaged street.
    Tacloban, 24 November 2013. A teacher DFID calls Jolita rescued some of her pupils when a 3-metre storm surge flooded the school where they were sheltering, close to Tacloban’s port. “We had to run for our lives,” she told DFID.Photo: DFID – UK Department for International Development · CC BY 2.0 · Wikimedia Commons
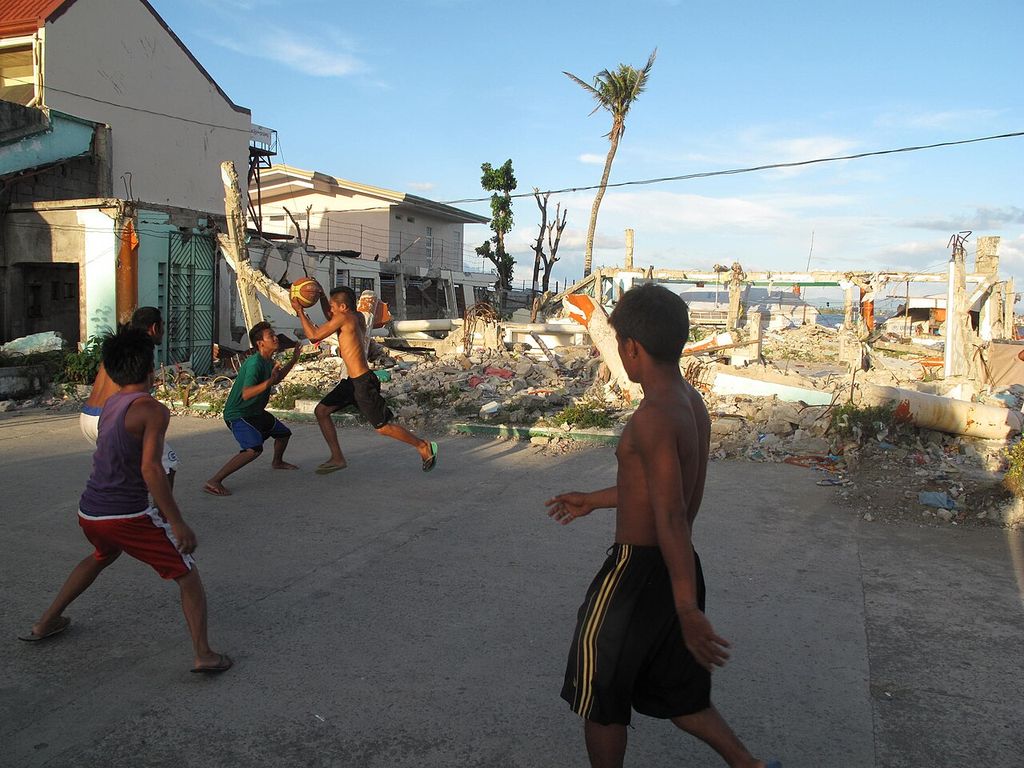
    Boys play basketball on a cleared court, with storm debris and damaged buildings behind them.
    Tacloban, 3 May 2014. Six months on, a basketball court cleared of rubble.Photo: DFID – UK Department for International Development · CC BY 2.0 · Wikimedia Commons
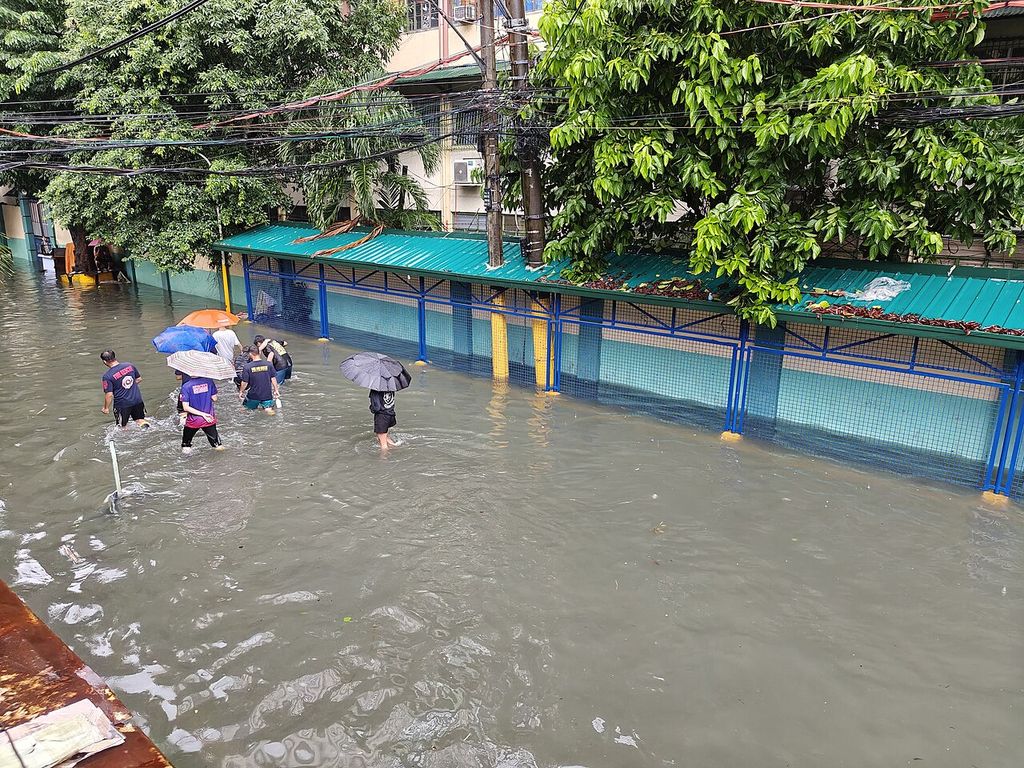
    People with umbrellas wade through knee-deep floodwater along a street in Quiapo, Manila.
    Quiapo, Manila, 24 July 2024. Knee-deep floodwater from the monsoon rain that Carina drew in.Photo: Michael Peronce · CC BY-SA 4.0 · Wikimedia Commons
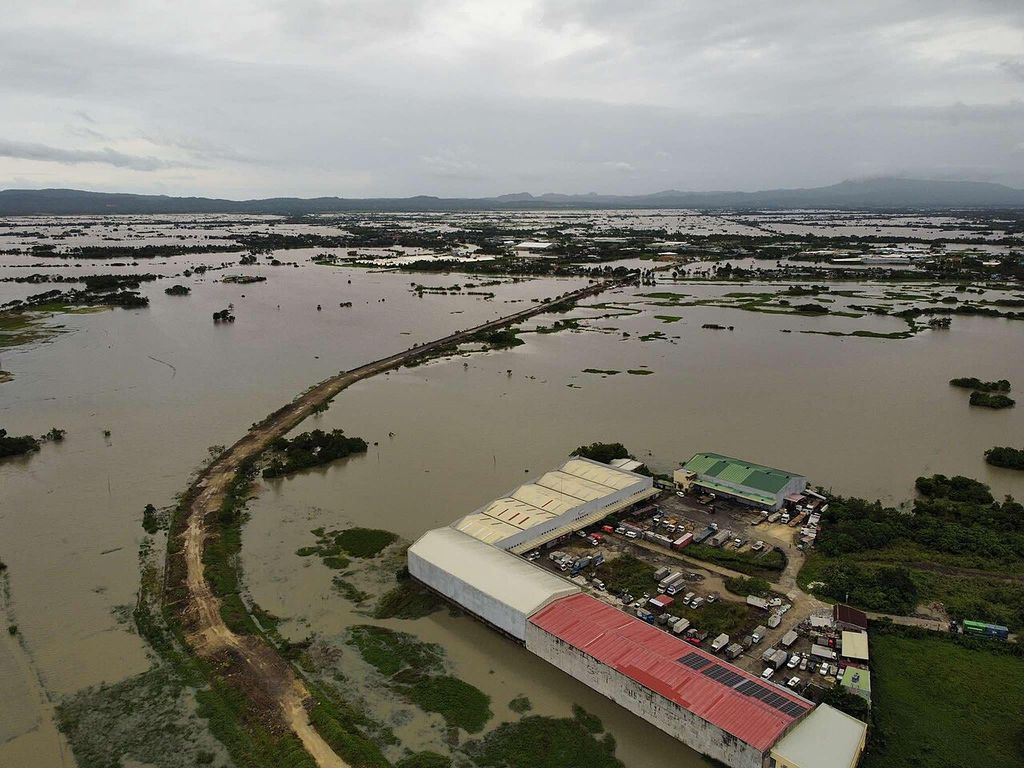
    Aerial view of rice fields under brown floodwater stretching to the horizon, crossed by a raised road.
    Naga, Camarines Sur, 23 October 2024. Rice fields under water after Kristine.Photo: Naga City Government · public domain (Philippine government work) · Wikimedia Commons
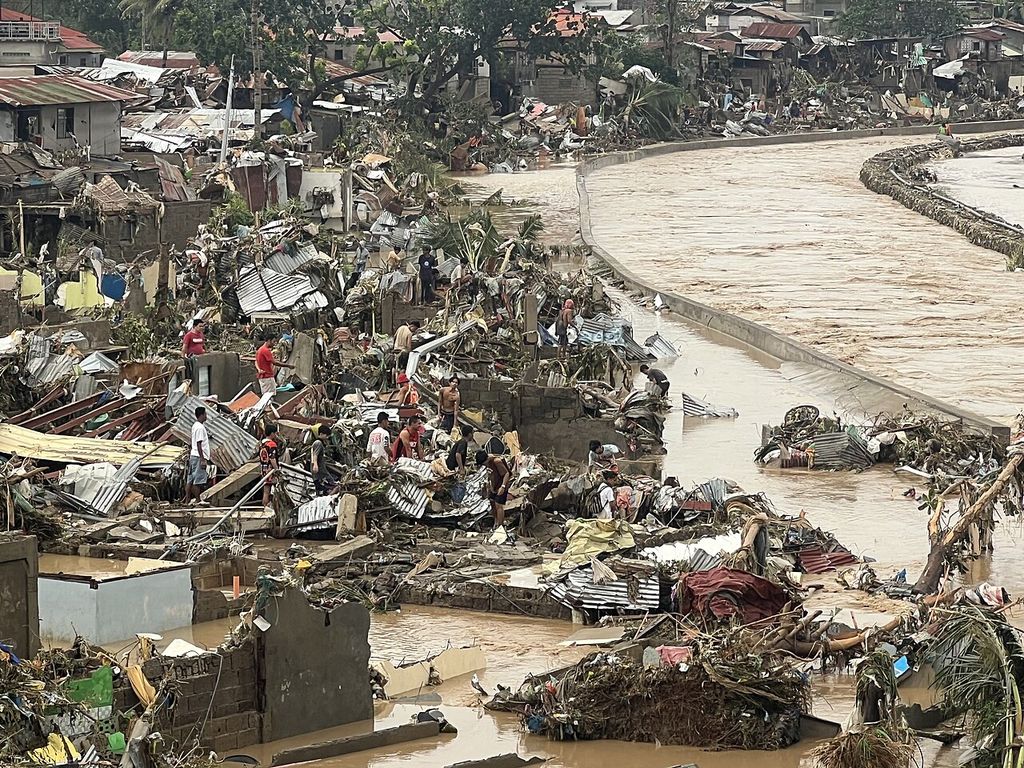
    The swollen brown Mananga River beside a bank of destroyed houses and debris, with people among the wreckage.
    Talisay, Cebu, 4 November 2025. The Mananga River swells as Tino batters Cebu.Photo: LadyPinayForever · CC0 · Wikimedia Commons

    Living with water

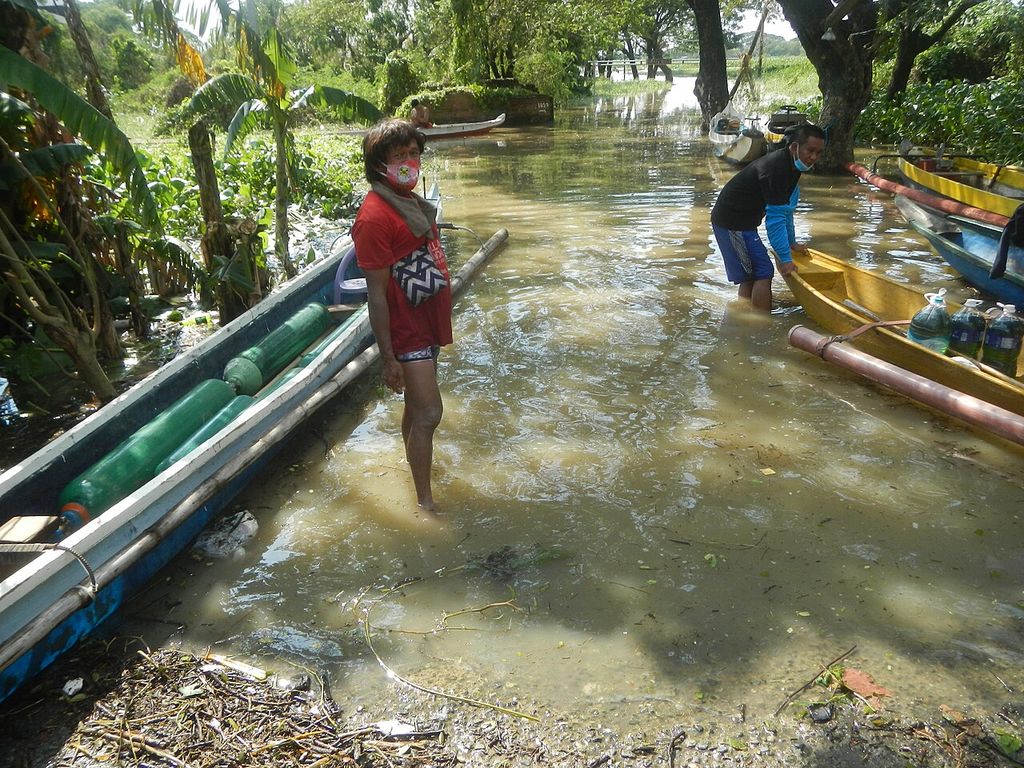
    For many families, flooding is not an event but a season, or a tide. Much of Metro Manila and the land around northern Manila Bay is sinking, largely because groundwater is pumped out faster than it returns. Between 2003 and 2011 parts of Caloocan, Malabon, Navotas and Valenzuela sank by up to 4.2 cm a year (source: Eco, Rodolfo, Sulapas et al., “Disaster in slow motion”, JSM Environmental Science & Ecology, 2020), and around northern Manila Bay several centimetres to more than a decimetre a year (source: Rodolfo and Siringan, Disasters, 2006). Metro Manila’s drains handle about 30 mm of rain an hour (source: Inquirer, 25 Jul 2024).

    In Macabebe, Pampanga, researchers in 2025 found neighbourhoods permanently under water (source: UP Resilience Institute, fieldwork in Macabebe and Obando, 2025). “Since July… the villages haven’t dried,” a local official told the Inquirer (source: Inquirer, “Pampanga folk break silence after years of flooding”, 1 Oct 2025) that October.

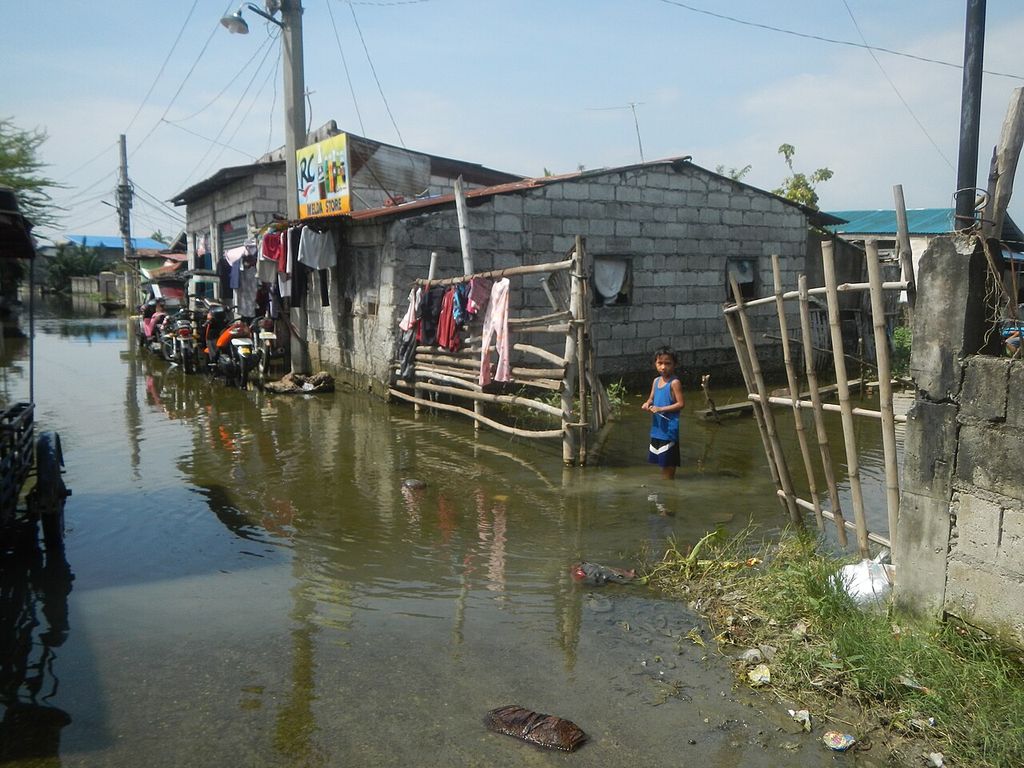
    Floodwater stands around concrete-block houses with laundry hanging out; a child stands in the water.
    San Francisco, Macabebe, Pampanga, 6 November 2020. Tidal flooding.Photo: Judgefloro · CC0 · Wikimedia Commons
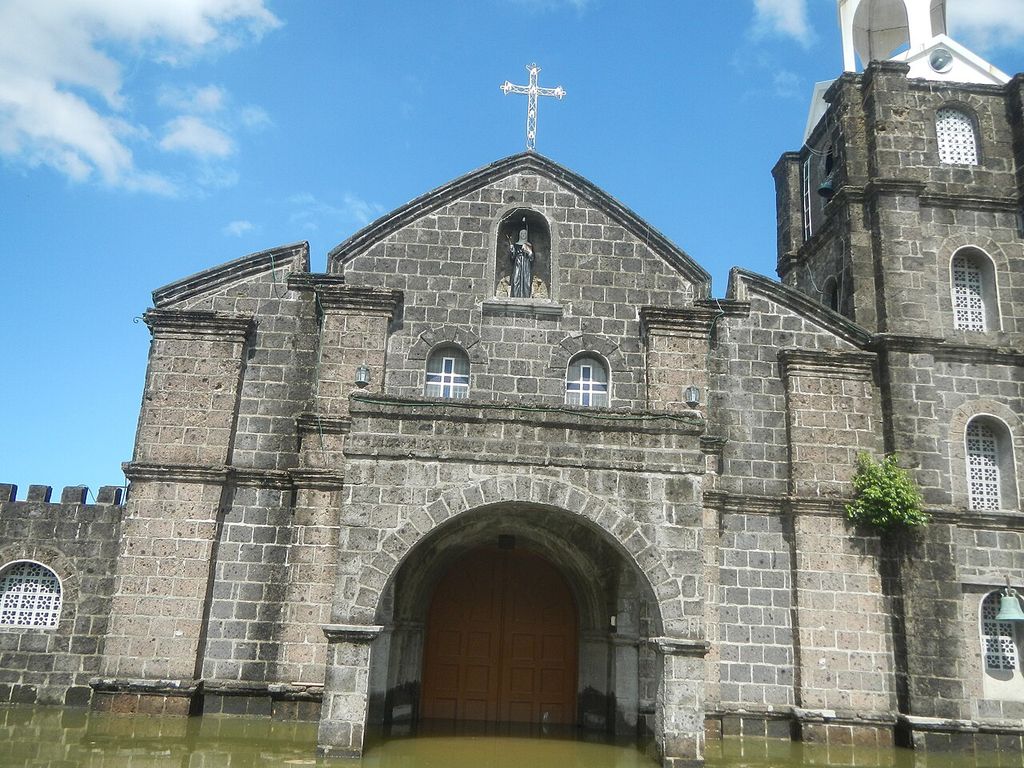
    A stone church whose doorway stands in floodwater.
    Santa Monica, Hagonoy, Bulacan, 18 November 2020. Standing water at the church door.Photo: Judgefloro · CC0 · Wikimedia Commons
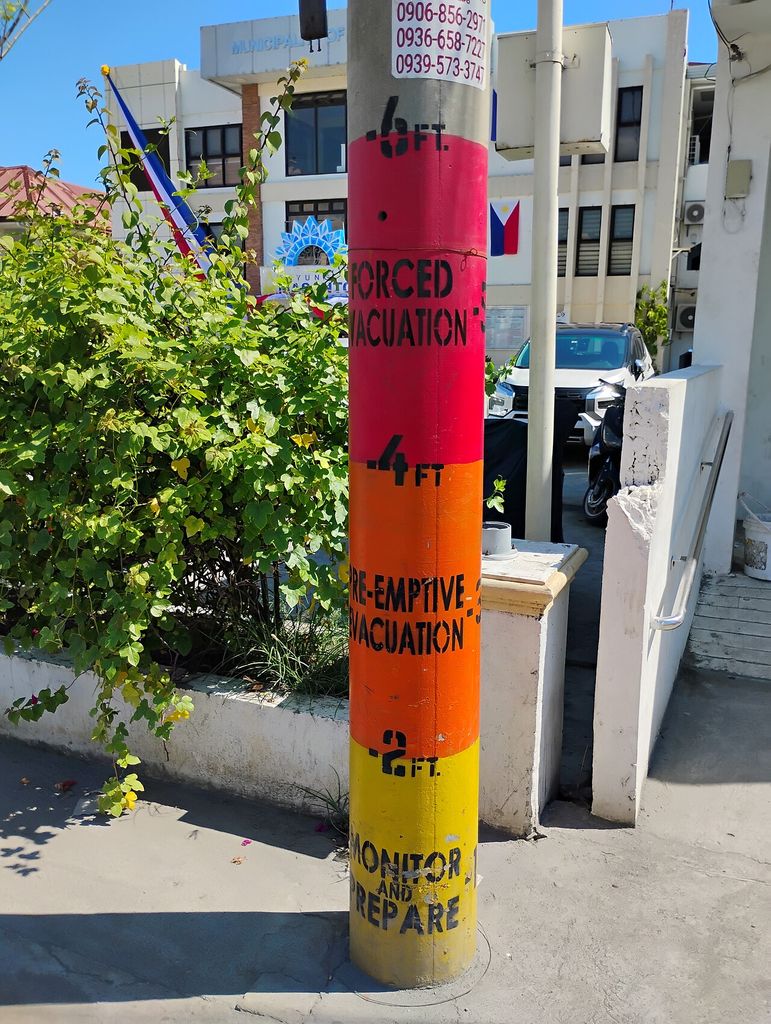
    A utility pole painted as a flood gauge: monitor and prepare at 2 feet, pre-emptive evacuation at 4 feet, forced evacuation above.
    Masantol, Pampanga, 15 June 2025. A flood gauge painted on a pole tells residents when to prepare and when to leave.Photo: Ralff Nestor Nacor · CC BY-SA 4.0 · Wikimedia Commons

    The politics of flood control

    In 2025 flood control became the country’s biggest political story. What follows is what happened and who said what, as reported by news outlets; people charged are presumed innocent until a court decides.

    1. In his State of the Nation Address, President Ferdinand Marcos Jr. condemned failed and “ghost” flood-control projects: “Mahiya naman kayo” (“Shame on you”). He ordered a list of every flood-control project of the past three years (source: Inquirer, 28 Jul 2025) and promised charges against those found connected (source: Philstar, 28 Jul 2025).

    2. He opened Sumbong sa Pangulo (“Report to the President”) (source: Inquirer, 11 Aug 2025), a public website mapping the projects, and said 15 contractors had won more than ₱100 billion of the ₱545 billion in 9,855 projects since July 2022 (source: GMA News special report, “The corruption of Philippine flood control projects”).

    3. Senate and House hearings followed. Public Works Secretary Manuel Bonoan resigned; Vince Dizon replaced him (source: Philstar, 31 Aug 2025). Contractors Sarah and Curlee Discaya named lawmakers and officials as allegedly involved; House Speaker Martin Romualdez and several others named denied it (source: GMA News, 8 Sep 2025).

    4. Vicente Sotto III replaced Francis Escudero as Senate President (source: Philstar, 9 Sep 2025), and Mr Romualdez resigned as House Speaker amid the allegations (source: Philstar, 17 Sep 2025), which he denies; Faustino Dy III succeeded him.

    5. An executive order created the Independent Commission for Infrastructure (source: Inquirer, 12 Sep 2025) to investigate public works of the past ten years, chaired by retired Justice Andres Reyes Jr. (source: SunStar, “Timeline: the flood control scandal”, 29 Oct 2025).

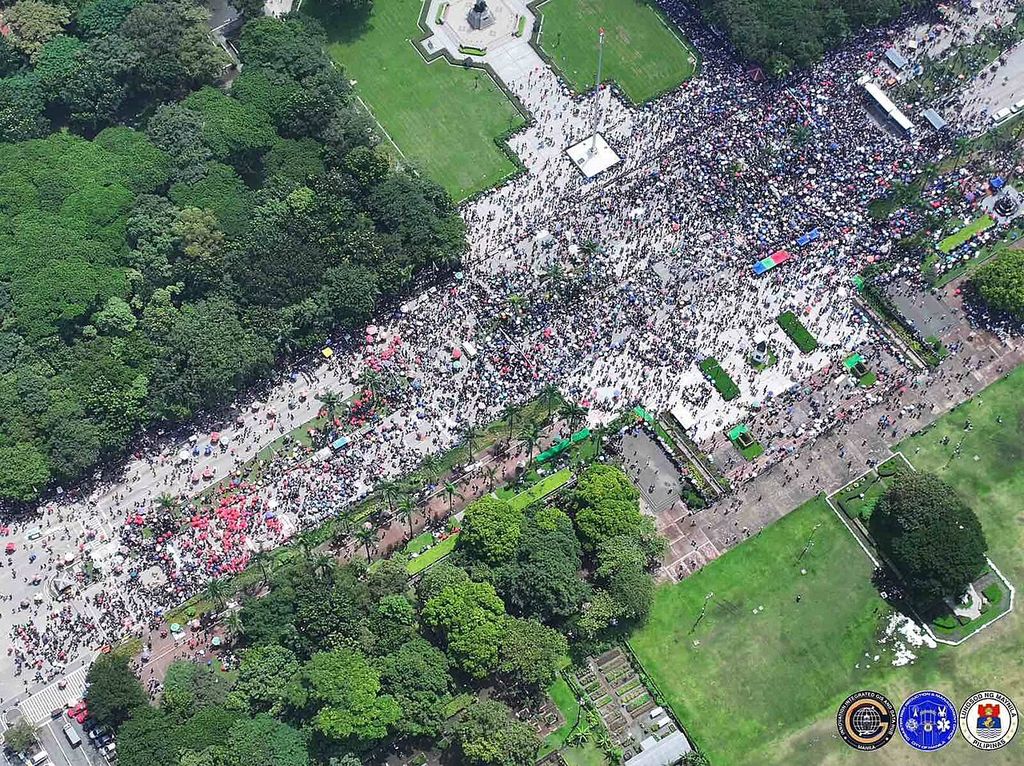
    6. Tens of thousands joined the Baha sa Luneta (“Flood at Luneta”) and Trillion Peso March protests: at least 50,000 at Luneta by the Manila disaster office’s count, and 60,000 to 70,000 at EDSA by the organisers’ (source: GMA News, 21 Sep 2025). Separate clashes near Mendiola ended in 216 arrests and more than 100 police and about 70 civilians injured (source: Philstar, 22 Sep 2025).

    7. After Typhoon Tino, the President ordered an investigation of Cebu’s flood-control projects (source: GMA Regional TV, 6 Nov 2025); Cebu’s governor said the province had received ₱26 billion in flood-control funds “yet we are flooded to the max”.

    8. The first cases reached the anti-graft court, which ordered the arrest of former Representative Zaldy Co and 15 others (source: Inquirer, Nov 2025) over a ₱289-million dike in Oriental Mindoro. Mr Co has remained abroad (source: Inquirer, “Gov’t fails to secure Co, now says he’s in France”, 2026). On 30 November police counted about 90,000 people at 119 rallies nationwide (source: Philstar, 1 Dec 2025).

    9. Former Senator Bong Revilla surrendered on a malversation warrant (source: Philstar, 19 Jan 2026). He has denied involvement; when he refused to enter a plea, the court entered not guilty for him (source: PhilSTAR Life, Revilla plea). Senator Jinggoy Estrada surrendered on a plunder warrant (source: SunStar, 1 Jun 2026) and denies the charges. The commission referred 65 people for prosecution and reported ₱24.7 billion in assets frozen, seized or surrendered (source: Philstar, 6 Feb 2026), then handed its evidence to prosecutors (source: Manila Bulletin, 23 Mar 2026).

    10. In his next address the President said more than ₱800 million had been returned (source: Inquirer, 27 Jul 2026); GMA News counted 45 people charged in 26 cases (source: GMA News, 28 Jul 2026).

    11. The Ombudsman charged former Speaker Romualdez with plunder (source: Philstar, 7 Sep 2026) over ₱7.44 billion; he denies wrongdoing. He was arrested, pleaded not guilty (source: Philstar, 17 Sep 2026) and has asked for bail (source: Inquirer, 28 Sep 2026). The anti-graft court said its first decisions may come this year (source: Daily Tribune, 10 Sep 2026).

    Aerial view of a large crowd filling a road and plaza in Rizal Park, Manila.
    Rizal Park, Manila, 21 September 2025, 10:45 a.m. The Baha sa Luneta (“Flood at Luneta”) protest from the air.Photo: Manila Public Information Office · public domain (Philippine government work) · Wikimedia Commons
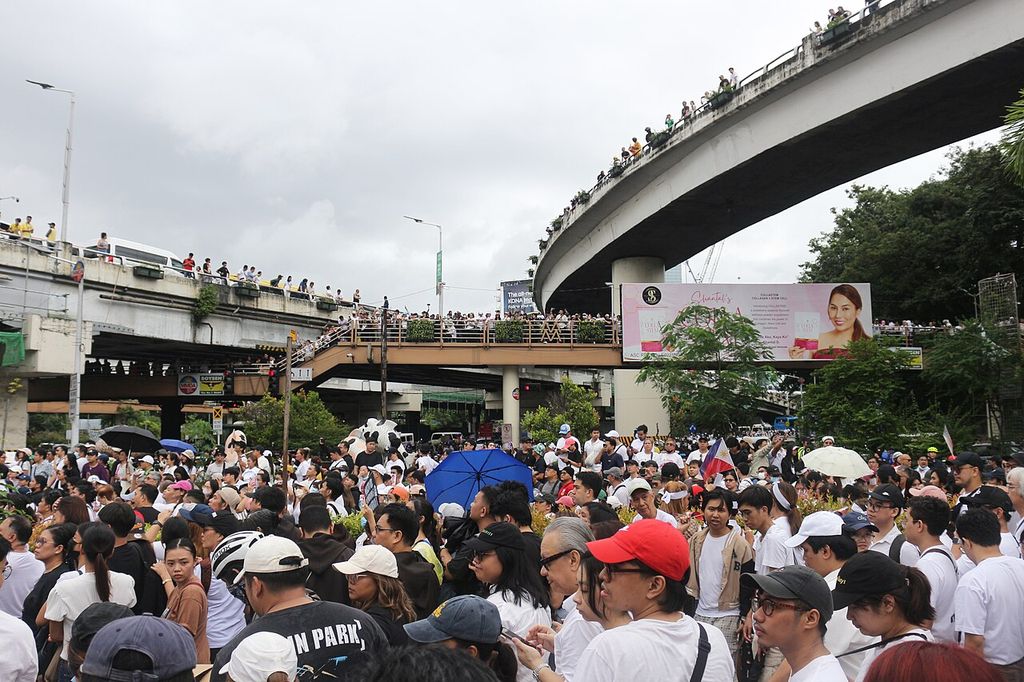
    A dense crowd fills a road beneath an elevated highway; more people watch from the overpass.
    Near the EDSA Shrine, Quezon City, 21 September 2025. The Trillion Peso March against corruption in flood-control projects.Photo: Sean Ronquillo (Ubediplomacy) · CC BY-SA 4.0 · Wikimedia Commons

    As of 1 October 2026 we found no report of a verdict in any of the flood-control cases.

    Photo credits

    Every photograph is from Wikimedia Commons under an open licence, credited under the photo with its licence and a link to its page. We resized them for the web and changed nothing else. Photos under CC BY-SA keep that licence. The Philippine government photos are public domain under Section 176 of the Intellectual Property Code.

    Facts and figures link to their sources where they appear. Tolls are the latest official counts we could find and may differ from other reports. Write to Noam (on the homepage) to correct anything here.

    BahaWatch

    About BahaWatch

    What it is

    BahaWatch answers one question for a street or barangay (neighbourhood): Babaha ba? — “Will it flood?” — and says how deep the water is for someone walking, riding a motorcycle or driving.

    This demo runs on synthetic data. Streets, buildings, terrain and flood hazard maps are real open data. The sensor readings, storms and neighbour reports are made up by a storm generator.

    In a real deployment, the dashboard is connected to real sensors. Each unit sends its water level to the dashboard’s server every 10 minutes, and the server combines those readings with the flood model and the datasets below to estimate what is happening on the ground, street by street. Only the source of the readings changes; the model, the rule and the maps are the same code.

    Not a forecast. Not for emergency use. Follow PAGASA and local government advisories.

    The sites

    • 25 PhilDev partner campuses in Luzon, the Visayas and Mindanao. Each has a 3 km map with eight proposed sensor spots.
    • Two neighbourhood pilots: Teachers Village, Quezon City, and Brgy. San Joaquin, Mabalacat City, Pampanga.
    • UC Berkeley, California: an experiment, not a planned site. We ran the same method on very accurate terrainThe US Geological Survey’s 1 m lidar map: an aircraft laser survey of the bare ground. Nothing like it is openly available for most of the Philippines, so Berkeley shows how the method behaves when the ground heights are right. to see how it behaves when the ground heights are right.

    How it works

    1. Sensors measure water on the street (simulated in this demo). Each household unitA small ultrasonic sensor on a gate post at the street’s edge, hosted by a household. It points down at the road and measures the distance to the surface: less distance, more water. See Sensor units below. sends the water depth in front of it every 10 minutes over LoRaWANA long-range, low-power radio network for small sensors. One gateway can hear units a few kilometres away in a city, each reading is only a few bytes, and it does not depend on mobile data, which often jams during storms..
    2. The model spreads that water over the map. At each wet sensor it sets a water level (ground height + measured depth) and lets it spread to nearby lower ground, until the ground rises above it. It fades with distanceThe water level drops 1 cm for every 15 m it travels, and spreading stops after about 1.2 km. Water also never spreads into ground more than 45 cm deeper than the sensor saw, so a 20 cm reading on a slope can’t flood a whole valley below it. Both rules keep the map on the cautious side. and goes around buildingsThe map is a grid of 7.5 m squares. A square at least 75% covered by building footprints blocks water; streets and creeks never block. Streets are cut 0.5 m into the terrain so they carry water, as real streets do.. No reading, no flood on the map.
    3. A rule gives the answer. The Babaha ba? (“Will it flood?”) ruleChecked in order; the first match wins. Nothing newer than 20 minutes: “No fresh data”. The sensor here reads 5 cm or more, or is rising to it within an hour: Oo (yes). Three or more neighbours report flooding within 1 km in the last hour, or heavy rain falls on a mapped hazard zone: Baka (maybe). One or two reports, or a trace at the sensor: Baka (maybe). Otherwise Hindi (no). Reports alone never give Oo; only a sensor can. combines sensors, neighbour reports and rain into Oo (yes), Baka (maybe), Hindi (no) or “No fresh data”.
    4. Depth becomes something you can act on. Water is described as gutter-, half-knee-, knee- or waist-deep, and as passable or not for carsFrom the MMDA Flood Gauge: half-tire (33 cm) is not passable to light vehicles, tire level (66 cm) is not passable to any vehicle. From 25 cm we say “drive slowly”, where Mamuyac et al. (2025) saw lane closures begin in MMDA CCTV footage. and motorcyclesOur own rule, because the MMDA gauge has none for motorcycles: slow from 15 cm, where the engine sits; not passable from 30 cm, the height of the exhaust and footpegs, where bikes stall..

    Two views: the simple view for residents (one answer, the street list, a map) and Details for operators and researchers (storm scenarios, a 36-hour timeline, each sensor’s readings, the NOAH layer).

    Data

    All open data, cut to each site by our pipeline and stored with the page.

    Ground height
    FABDEMA global map of ground height with buildings and trees removed (Hawker et al. 2022, University of Bristol), made from the 30 m Copernicus satellite elevation map with machine learning. Bare ground is what water flows over. Free for non-commercial use., 30 m, smoothed onto the 7.5 m grid. USGS 1 m lidar at Berkeley.Where water can go.
    Buildings
    FootprintsBuilding outlines traced from satellite images by Google and Microsoft, merged with OpenStreetMap. They can miss small, new or informal buildings, and can’t tell a house from a warehouse or count floors. from Google Open Buildings, Microsoft and OpenStreetMap, combined by VIDA.What blocks water; buildings counted in flooded areas; the map.
    Streets, creeks, names
    OpenStreetMapA free world map drawn by volunteers, like a Wikipedia for maps. Coverage in Philippine cities is good; small alleys and creeks can be missing..Streets cut into the terrain as water paths; street names in answers; the map.
    Flood hazard
    UP Project NOAHFlood hazard maps from the University of the Philippines (Project NOAH, now the UP Resilience Institute), modelled for rain heavy enough to come once in 5, 25 or 100 years on average. They show mostly river and overland flooding; ponding from blocked drains often doesn’t appear. 5-, 25- and 100-year maps.A reference layer to compare with; the rain rule; choosing sensor spots; shaping the simulated storms. Never used to draw the flood.
    Barangays (neighbourhoods)
    PSA and NAMRIA boundaries, via OCHA HDX.“My barangay” answers.
    Depth levels
    MMDA Flood Gauge; Mamuyac et al. 2025, Natural Hazards.Depth words and passability.
    Rain
    Open-Meteo hourly rain, in live mode only (not switched on yet).The rain step of the rule.
    Terrain check
    NASA ICESat-2A NASA satellite laser that measures ground height along narrow tracks, to within tens of centimetres on open ground. We used 17,936 of its ground points at 26 sites as the reference to test FABDEM. ground heights, 2019–2026.Measuring how wrong the terrain is (see Accuracy).
    Simulated
    Sensor readings, storms, neighbour reports.Everything that moves.

    How the data are processed

    For researchers who want the details: every step from the raw downloads to the answer on a phone. Scripts are named as they are in the repository.

    1. 1Open data, downloaded once

      • FABDEM V1-2 ground height, 30 m tiles, EGM2008 heights
      • OpenStreetMap Philippines extract (Geofabrik): streets, creeks, names, campus outlines
      • Building footprints (Google, Microsoft, OpenStreetMap, combined by VIDA)
      • NOAH hazard maps, 5-, 25- and 100-year, per province
      • Barangay boundaries (PSA, NAMRIA via OCHA HDX)
      • PhilDev campus list (pipeline/campuses.csv)
    2. 2Cut to each site pipeline/run_pc.py

      • find: match each campus name to its OpenStreetMap outline.
      • cut: a box of about 3 × 3 km around each campus or pilot: terrain tiles merged and clipped, buildings, streets and creeks, NOAH polygons, barangays and the outline.
    3. 3Build each site file build_data.py

      1. Grid. 400 × 400 squares of 7.5 m; terrain kept on a 15 m grid inside the file.
      2. Terrain. FABDEM sampled onto the 15 m grid and smoothed (Gaussian, 1 cell), then rebuilt at 7.5 m by bilinear interpolation.
      3. Streets. Mapped streets become a 7.5 m street mask, cut 0.5 m below the lowest ground within 5 × 5 squares (about 40 m), so streets carry water.
      4. Buildings. Footprints become the share of each square that is built; a square at least 75% built blocks water (streets and creeks never block).
      5. Sea. Squares at or below 0 m that connect to the edge of the box.
      6. Hazard and places. NOAH classes per square for each return period; barangay and street places with their sensors (tools/build_places.py).
      7. Sensor spots. Placement score (lowness, hazard, nearness to water), spaced 300 m apart; each unit snapped to its street square and given that square’s ground height.
      8. Checks. File size (≤ 250 KB compressed), spacing, units inside the box (tools/check_site_data.py), then written to data/<site>.json.
    4. 4Map tiles and labels

      • Streets, buildings and waterways as vector tiles (tippecanoe → PMTiles, tools/build_basemap.py), served from our own site.
      • Map-label glyphs in Atkinson Hyperlegible Next (tools/build_glyphs.py).
    5. 5In the browser, at every reading

      1. Reading in. Each unit’s depth (here from the storm generator; live, from the server).
      2. Water level. Ground height at the unit’s street square + depth.
      3. Spread. From the street square to neighbouring squares (up, down, left, right). A square floods if 2 cm < level − 1 cm per 15 m travelled − ground ≤ depth + 45 cm; otherwise the water stops there. Blocked and sea squares are skipped; the spread ends 1.2 km out.
      4. Overlaps. Where two units reach the same square, the deeper estimate wins, and the square remembers which unit it came from.
      5. Drawing. Depth sampled four times finer (about 1.9 m) so the shoreline follows the terrain; building outlines cut out of the water; colours from the depth spectrum.
      6. Counts. Buildings in flooded squares, streets cut, and a rough residents estimate (4.2 people per building).
      7. Answer. The Babaha ba? (“Will it flood?”) rule (shared/verdict.js) from sensors, neighbour reports and rain.
    6. 6Live mode Designed, not switched on

      • Units’ readings arrive over LoRaWAN at a small server (Cloudflare Workers and a D1 database, on free plans), with hourly rain from Open-Meteo and neighbours’ reports.
      • Every 5 minutes it works out each place’s answer with the same rule file the demo uses, so demo and live answers can never drift apart.

    Code: MIT licence. FABDEM’s licence is non-commercial (CC BY-NC-SA 4.0), so the Philippine site files are too. Full list in the repository’s DATA-LICENSE.md.

    Sensor units

    No units are installed yet. This is what the dashboard assumes about a unit, written down so it can be checked in the field.

    The device

    An ultrasonic distance sensorIt sends a short sound pulse, too high to hear, and times the echo from the surface below. Nothing touches the floodwater, so there is less dirt and damage than with a sensor sitting in the water. pointing down at the street, with a LoRaWAN radio and a battery. About US$210 per unit (our estimate). Each reading carries only the unit’s ID, the time, the water depth and the unit’s location.

    How it is mounted Our assumptions, not yet field-tested

    Where
    On a household gate post or front wall at the street’s edge, with the household’s consent.
    Looking at
    Street pavement straight below: not the yard, a canal or a drain opening. A clear patch about half a metre wide, where cars don’t usually park.
    Height
    About 2 m above the roadThe prototype’s ultrasonic sensor reads distances from 0.5 to 10 m. At 2 m a unit still reads water up to about 1.5 m deep, past the waist-deep level the dashboard shows, and it sits above most heads and splashes. A person or vehicle passing under gives a short false reading, so a unit should report the median of several pings..
    Zero point
    At install, on a dry day, the unit records the distance to dry pavement. Water depth = that distance − the distance now.
    Ground height
    Taken from the terrain map at the unit’s street square, not surveyed. Terrain error shifts the unit’s water level by the same amount.
    Radio
    Within range of a LoRaWAN gateway; one reading every 10 to 15 minutes (the demo simulates every 10).
    Warning
    The unit’s microcontroller tracks how fast the water rises and sends a warning before it reaches a set level.

    Where the spots come from

    Teachers Village’s eight units were placed by hand along its low streets. Everywhere else a rule picks themCandidates are houses within 25 m of a street and at least 300 m inside the map’s edge. Each gets a score: 0.5 × how low it sits (the share of ground within 300 m that is higher) + 0.3 × NOAH hazard + 0.2 × closeness to a creek or river (zero at 300 m). The best eight are picked at least 300 m apart (250 m, then 200 m, if eight don’t fit).: low ground, mapped hazard, near water, spread apart. On a campus, unit 01 is on campus and the rest are in the barangays (neighbourhoods) around it; in San Joaquin all eight are inside the barangay.

    The spots are proposals, not surveyed or agreed with residents.

    Accuracy and limits

    The depth at a sensor is measured. How far the water spreads from it is only as good as the terrain map, and the terrain is the weakest part.

    Terrain error, measured

    We compared FABDEM with 17,936 ICESat-2 ground points at 26 sites:

    • Typical error about 1.4 m (NMADNormalised median absolute deviation: a measure of typical error that isn’t thrown off by a few wild points. For roughly normal errors, about two-thirds of points fall within ±1 NMAD.); median +0.66 m (the map sits a little above the ground).
    • 46% of points within 1 m, 72% within 2 m.
    • Open campuses (CLSU, LLCC, MSU-IIT, CMU): 0.4–0.8 m.
    • Old Manila core (UST, FEU Tech, Mapúa, UDM): the map is about 2 m too high; only 2–12% of points within 1 m.

    Error grows with how built-up a place is. In tight streets the satellite can mistake roofs for ground, so the real error there may be larger.

    Why a terrain error is not the whole story

    The water level is set from the map’s own ground height at the sensor, and then compared with the map’s ground height elsewhere. An error that is the same everywhere (the whole map sitting 1 m too high) cancels out. What moves the edges is error that changes from street to street, which is what NMAD measures. A sensor sitting on a spot the map gets badly wrong, though, shifts its whole patch of water.

    Every setting the model uses

    SettingValueWhy, and what it costs
    Grid7.5 m squares; terrain detail 15 m (FABDEM is 30 m)Streets in barangays (neighbourhoods) are often 4–8 m wide. A finer grid separates streets from houses but adds no height detail.
    SmoothingGaussian, 1 cell (15 m)Removes satellite noise; also softens real kerbs and small walls.
    Street cut0.5 m below the lowest ground within about 40 mMakes streets connected channels, as they are; a guess, not a survey.
    BuildingsA square ≥ 75% built blocks waterWater goes around blocks; real houses let some water in, and merged footprints can close real alleys.
    Wet thresholdOver 2 cmBelow this, a square is treated as dry.
    Depth bandUp to the reading + 45 cmStops a shallow reading on a slope from flooding a deep valley below it.
    Fading1 cm per 15 m from the sensorKeeps far estimates cautious; real water surfaces are nearly flat over short distances.
    Reach1.2 km from each sensorBeyond this, the map says nothing rather than guess.
    Residents4.2 people per buildingClose to the average Philippine household; buildings with several households are undercounted.
    Fresh data20 minutesTwo missed readings; after that the answer becomes “No fresh data”.
    Oo (yes)Sensor ≥ 5 cm, or rising to it within 60 minutesOnly a sensor can say yes.
    Baka (maybe)3 or more reports within 1 km in an hour; rain ≥ 7.5 mm/h on a NOAH 5- or 25-year zone, or ≥ 15 mm/h on any mapped zone; 1–2 reports; or a 1 cm traceThe rain levels follow PAGASA’s yellow and orange rainfall warnings. A dry sensor within 500 m is shown against reports.
    PassabilityCars: slow from 25 cm, not light vehicles from 33 cm, none from 66 cm. Motorcycles: slow from 15 cm, not passable from 30 cm.Car levels from the MMDA Flood Gauge and Mamuyac et al. (2025); motorcycle levels are our own rule.

    The simulated readings

    Each storm is a rain pulse over 36 hours (two pulses for a typhoon). A unit’s depth = (rain × how susceptible its spot is − 2 cm) × a small random factor, capped at 90 cm. Susceptibility grows with how low the spot is and its NOAH hazard class. Replays are identical (a fixed random seed). This makes the demo look plausible; it is not a forecast and is not evidence that the model is right.

    What has not been checked yet

    • No comparison with real floods. No mapped extent has been compared with an observed flood (satellite flood maps, geotagged photos, MMDA reports). That is the next step.
    • No real readings. The thresholds (5 cm, 20 minutes, 45 cm, 1 cm per 15 m) are reasoned, not tuned on data.
    • Sensor accuracy in rain, heat and debris, and how often a passer-by gives a false reading, still have to be measured on the bench and in the field.
    • Edges are no sharper than the terrain. The shoreline is drawn about 1.9 m fine, but it is interpolated from 15 m terrain.

    Other limits and biases

    • No moving water. The model does not simulate rain, runoff, drains, flow speed or volume. It shows where the measured water level can reach; places far from any sensor stay blank.
    • New 7.5 m grid, not yet validated. Finer building squares block more water; on dense campuses the spread shrank (UST: 90 to 48 ha at the same storm moment). It may now understate floods there.
    • Buildings. Footprints miss small, new and informal homes, so dense informal areas are undercounted. “Residents affected” is a rough multiple of buildings.
    • The demo agrees with NOAH by design. The simulated storms flood low, NOAH-flagged spots first, so the demo looking plausible is not evidence that the model is right.
    • Sensor spots favour low ground. Good for seeing water early, but higher streets get answers from reports and rain only (“No sensor here yet”).
    • Who gets heard. Reporting needs a smartphone and data; hosting needs a gate post and a willing household. Renters, older residents and informal settlers may be under-represented.
    • Not modelled: storm surge, tides, dam releases.
    • Languages. Cebuano, Ilokano, Hiligaynon and Kapampangan were drafted without a native speaker and are marked for review.

    Future work

    • Real sensors. Bench-test the unit, then a pilot street in Teachers Village or San Joaquin; replay a recorded storm on the dashboard.
    • Check against real floods. Compare mapped extents with observed flooding from a past typhoon: MMDA flood reports, geotagged photos, barangay (village) records.
    • Better terrain. Test FathomDEMA newer bare-earth elevation map (Fathom, 2025) built for flood modelling. Its authors report smaller errors than FABDEM, including in cities; we have asked for access and will run the same ICESat-2 check on it. (access requested) and 1 m Phil-LiDAR maps where available; survey each unit’s ground height at install.
    • Water that moves. Try a simple two-dimensional flow model for direction and timing, and add drainage where it is mapped.
    • Count flooded buildings by outline, not by grid square.
    • Go live. Switch on the server for real answers, rain and reports; add SMS for phones without data.
    • Design with residents. Work with barangays and households on where units go, who hosts them and how the answer is worded; native-speaker review of every language.
    • Data governance. Agree who owns the readings and reports, and how long they are kept.

    FAQ

    Is any of this real?

    The map is: streets, buildings, terrain, barangays (neighbourhoods) and NOAH hazard layers all come from open data. The sensor readings, storms and neighbour reports are synthetic, and every page says so. In a real deployment, sensors send their readings to the dashboard’s server, and everything after that (the model, the answer rule, the maps) runs exactly as in the demo.

    Why not just use the NOAH hazard maps?

    NOAH shows where floods can happen in a storm of a given size, not what is happening now. It is modelled mainly for rivers and overland flow, so it often misses street ponding from blocked drains; in Teachers Village it is blank across the Maginhawa interior, which is known to flood. BahaWatch keeps NOAH as a layer to compare against.

    How accurate is the flood map?

    At a sensor, as accurate as the sensor. Away from it, the spread depends on terrain, which is typically about 1.4 m off and about 2 m too high in old Manila. Read the extents as a guide to where water is likely, not a street-by-street survey. Details under Accuracy and limits.

    Is it a forecast?

    No. It maps water measured now. Its only look-ahead is one hour: a sensor rising fast enough to reach 5 cm within the hour already counts as Oo (yes). For warnings, follow PAGASA and your local government.

    Why ultrasonic sensors, not pressure sensors or cameras?

    An ultrasonic unit never touches the floodwater, is cheap, and sends one number. A pressure sensor must sit in dirty water on the road; a camera sends images, which needs more bandwidth and raises privacy concerns. The trade-offs: a short blind zone, false echoes from people or debris, and a reading that needs correcting for air temperature.

    What if power or signal is lost?

    Every answer shows its age. If nothing is newer than 20 minutes, the answer becomes “No fresh data”; it never says Hindi (no) on old data. The page itself opens without signal and shows the last answer with its time.

    How do you stop fake or mistaken reports?

    Reports alone can only raise Baka (maybe); only a sensor can say Oo (yes). It takes three different phones within 1 km in the last hour, one report per phone per place every 10 minutes, and a report from more than 2 km away is refused. Reports expire after an hour, and a dry sensor nearby is shown against them.

    What do you store about people?

    No accounts, names or phone numbers. A report’s position is rounded to about 100 m and used only when the phone is within 1 km of the place. Report IDs are erased after an hour and raw reports deleted after 30 days. This applies in live mode; the demo sends nothing.

    What does it cost to run?

    The site is plain files on GitHub Pages, with its own map tiles: no running cost. The live server is designed for Cloudflare’s free plan (not switched on yet). Hardware: about US$210 per unit (our estimate), plus a LoRaWAN gateway per area.

    Does it work on cheap phones and slow connections?

    A campus page loaded in about 3 seconds on a simulated fast 3G connection in our tests; each site’s data is at most 250 KB compressed. Once opened, the page opens again without signal. It comes in six languages, uses shapes as well as colours, and has screen-reader text for every map.

    Can it be set up somewhere new?

    Yes, anywhere the open datasets cover: give the pipeline a map box and it cuts terrain, buildings, streets, NOAH layers and barangays, then proposes sensor spots. San Joaquin was added this way. NOAH coverage and footprint quality vary by province.

    Why is UC Berkeley on a Philippine dashboard?

    It was an experiment. Berkeley has 1 m lidar terrain, so we ran the same method there to see how it behaves on well-known ground, and to try the dashboard with US units and wording. It is not a planned deployment.

    Why a 7.5 m grid?

    Barangay streets are often 4–8 m wide. With 15 m squares, houses and streets merged and water leaked through blocks. Buildings and streets are now on 7.5 m squares; the terrain keeps FABDEM’s detail, since finer squares add no height information.

    BahaWatch is a research prototype. Map data © OpenStreetMap contributors; terrain FABDEM © University of Bristol; hazard UP NOAH / UP Resilience Institute; boundaries PSA / NAMRIA.

    BahaWatch

    Accessibility

    Floods hit everyone: older residents, people with low vision or colour blindness, people on cheap phones with weak signal. These are the choices we made so the dashboard works for as many of them as we can, and where it still falls short.

    Our target is the Web Content Accessibility Guidelines (WCAG) 2.1 at level AA, with larger touch targets. Most of what follows is checked by automated tests that run on every change.

    Typeface

    All text, including the map labels and the depth figure, is set in Atkinson Hyperlegible Next, a typeface the Braille Institute designed for readers with low vision. Letters that are easy to confuse are drawn to differ: capital I has serifs, lower-case l has a tail, and zero has a slash.

    • Nothing is smaller than 12 px, and 12 px is used only for credits, times and helper lines. Reading text is 16 px.
    • Three weights only (regular, semibold, bold), so emphasis stays clear.
    • Lines of reading text stop at about 72 characters.

    Colour and shape

    • Contrast. Text has at least 4.5:1 contrast with its background, and large text, borders and map markers at least 3:1, in both the light and the dark theme. The theme follows your device and can be switched with the ☾ / ☀ button.
    • Shape as well as colour. Status never depends on colour alone: ring: normaltriangle: water on the streetsquare: floodeddashed box: no fresh data Campus pins use the same idea: circle for state universities, square for local, triangle for private.
    • Colour-blind-safe colours. Status colours come from the Okabe–Ito palette, darkened until they pass the contrast rules; figure colours follow Jack Baker’s guidance. Our tests check the pins and markers under simulated red, green and blue colour blindness (Machado, Oliveira and Fernandes, 2009).
    • Water reads in greyscale. Depth runs from a pale to a dark blue in one even spectrum, so deeper water is darker even in a black-and-white printout. The NOAH hazard layer uses purples, and the sea a grey-blue, kept clearly apart from both.

    Touch and keyboard

    • Buttons and links are at least 48 × 48 px, larger than the WCAG minimum, for older hands and moving vehicles. The site tabs and a few Details controls are the exceptions (see below).
    • Everything works with a keyboard. Focus shows as a thick blue outline. Arrow keys move between tabs; Escape closes notes and pop-ups; on the detailed map, + and − zoom, the arrow keys pan and 0 resets.
    • No page scrolls sideways, from a 375 px phone to a desktop screen; the tabs wrap onto a second row instead.
    • Underlined terms open a short note when tapped, clicked or hovered, and the note stays inside the screen.

    Screen readers

    • Every map has a written description, and every pin and sensor has a spoken label (for example, its name, place and status).
    • The answer to Babaha ba? (“Will it flood?”) is announced when it changes, not every time the screen redraws, and the announcement starts by saying the storm is simulated.
    • The street list carries everything the map shows, as text, so the map is never the only way to get an answer.
    • Figures and decorative drawings are either described or hidden from screen readers.

    Motion

    • If your device is set to reduce motion, nothing animates: the storm does not play by itself, maps jump instead of flying, and the homepage drawings stand still.
    • Otherwise animation is short and only moves or fades things; nothing flashes.
    • While a site’s file or the map is loading, a thin bar at the top of the screen and a note on the map say so, so a slow connection never looks like a broken page.

    Words and languages

    • Six languages on the Philippine sites: English, Filipino, Cebuano, Ilokano, Hiligaynon and Kapampangan.
    • Plain words in the style of MMDA and PAGASA advisories. Depth is given in body terms (gutter-, knee-, waist-deep) and in centimetres and inches, with a drawing of a person, a motorcycle and a car.
    • The page always says what is simulated, never blames the reader, and never says “no” (Hindi) on old data: it says “No fresh data” instead.
    • No accounts and no sign-up, which keep out many older users.

    Slow phones and connections

    • Each site’s data is at most 250 KB compressed; a campus page loads in about 3 seconds on a simulated fast 3G connection in our tests.
    • Once opened, the page opens again without signal and shows the last answer with its time.
    • The maps are served from our own site, with no paid map service that could be switched off.

    What still falls short

    • The detailed map is a drawing: a screen reader cannot move from marker to marker on it. The street list is the way through.
    • Cebuano, Ilokano, Hiligaynon and Kapampangan were drafted without a native speaker and are marked for review. The homepage, About and this page are in English only.
    • The site tabs are 40 px tall, and a few controls in the Details view are smaller than 48 px.
    • The homepage drawings repeat while they are on screen; they stop only when the device is set to reduce motion.
    • We have not yet tested with people who use screen readers or magnifiers every day. We would like to: please get in touch.
    BahaWatch logo
    BahaWatch
    Teachers Village, Quezon City

    —

    Babaha ba? · —
    —

    May baha ba rito?

    My street

    Monitored streets

    00:00
    BahaWatch logo

    BahaWatch

    Teachers Village, Quezon City · household sensor network on real terrain
    Real map & terrain · sensor feed simulated

    Map data © OpenStreetMap contributors · Terrain: Copernicus GLO-30 © ESA/DLR/Airbus via OpenTopography · Hazard: UP Project NOAH (ODbL)
    Map helpScroll or pinch to zoom, drag to pan, and point at the water for its depth. Keys: + and − zoom, the arrow keys pan, 0 resets the view.
    1×
    00:00Simulated PHT